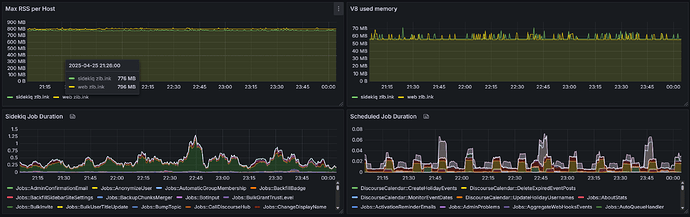
The image shows four graphs depicting performance metrics for a system, including Max RSS per Host, V8 Used Memory, Sidekiq Job Duration, and Scheduled Job Duration, with timestamps from April 25, 2025, showing various spikes and activities. (عنوان تم إنشاؤه بواسطة الذكاء الاصطناعي)2136×674 200 KB


