Crius
Junho 16, 2023, 2:39pm
1
Olá,
esta mensagem começou a aparecer quase constantemente desde que atualizei o Discourse há alguns dias.
Eu não teria aberto um tópico aqui se não fosse pelo motivo de… não ser verdade.
Verificar os recursos usados/disponíveis no host não mostra a máquina sobrecarregada ou algo do tipo.
Alguém pode me ajudar a entender como essa mensagem é acionada para que eu possa começar a investigar o que pode estar causando este aviso quando, na verdade, não é o caso?
Stephen
Junho 16, 2023, 3:33pm
2
Essa mensagem é significativa, o fato de seu sistema ter recursos livres é mais indicativo de má configuração do que de má identificação.
Quantos unicorn_workers você tem?
Assumindo que não há mais nada no host, você alocou 16 (dois por núcleo)?
Se você estiver usando Postgres local, quais são seus db_shared_buffers?
Crius
Junho 16, 2023, 4:21pm
3
Deixei as configurações padrão da configuração inicial do ./launcher e eram 8 workers.db_shared_buffers: 4096MB
No entanto, devido a alguns testes, o motivo pelo qual você pode ler aqui , os workers foram reduzidos para 4. Não teve efeito, então posso pelo menos restaurá-los para 8.
O motivo pelo qual não é 2xCore é que esta é uma VM e esses são vCPUs, na verdade, não núcleos reais.
Vou monitorar a instância por um tempo e voltarei para atribuir a solução, se for o caso, obrigado @Stephen
Stephen
Junho 16, 2023, 4:25pm
4
A mensagem está relacionada aos recursos que você aloca para o Discourse, não aos recursos da VM/host.
Obtenha db_shared_buffers com 25% da sua memória reservada e 2 workers do unicorn por CPU. Pode ser necessário algum ajuste fino.
Obviamente, você também precisa gerenciar recursos fora da VM se sentir que o pool de recursos não é confiável. Quase todo mundo que executa o Discourse o faz em algum tipo de VPS.
Crius
Junho 16, 2023, 6:14pm
5
Não sou especialista em discourse, então simplesmente executei o script que o instala, pois me lembro que ele deveria definir esses parâmetros com base na memória/cpu disponíveis.
Restaurei os workers como estavam antes de alguns testes e verificarei novamente.
Terei em mente sua sugestão de 2x núcleos para workers e 25% da memória reservada para os buffers compartilhados do banco de dados.
Quando você diz memória reservada, você quer dizer a memória reservada pelo contêiner em execução? Porque parece que é sempre “o máximo que o host tem disponível”
Stephen
Junho 16, 2023, 6:29pm
6
é isso que o discourse-setup faz:
# db_shared_buffers: 128MB para 1GB, 256MB para 2GB, ou 256MB * GB, máximo 4096MB
# UNICORN_WORKERS: 2 * GB para 2GB ou menos, ou 2 * CPU, máximo 8
‘máximo’ pode ser levado com uma pitada de sal ali, particularmente grandes comunidades verão benefícios além desses números.
Então sim, no seu caso, deveria ter especificado os máximos de 8 workers e 4096MB. Se você reduzir os workers e os buffers compartilhados disponíveis para o Discourse, ele atingirá o limite antes que todos os recursos da VM sejam consumidos.
Esta postagem de @mpalmer ainda é uma boa orientação:
Increasing the number of unicorn workers to suit your CPU and RAM capacity is perfectly reasonable. The “two unicorns per core” guideline is a starting figure. CPUs differ (wildly) in their performance, and VPSes make that even more complicated (because you can never tell who else is on the box and what they’re doing with the CPU), so you start conservative, and if you find that you’re running out of unicorns before you’re running out of CPU and RAM, then you just keep increasing the unicorns. …
Ed_S
Junho 16, 2023, 7:31pm
7
Para mim, parece que ela é acionada quando as requisições ficam enfileiradas por muito tempo - em outras palavras, requisições chegando mais rápido do que estão sendo atendidas. Pode-se perguntar por que tantas requisições, ou por que um serviço tão lento. No nível do Discourse, existem parâmetros ajustáveis que já são discutidos neste tópico e também, por exemplo, em Erro de carga extrema .
No nível do Linux, eu verificaria
uptime
free
vmstat 5 5
ps auxrc
Crius
Junho 30, 2023, 7:00pm
8
Apenas atualizando: aumentar o número de workers corrigiu o problema
Crius
Julho 12, 2023, 2:20pm
9
Seguimento rápido.
Desde então, as coisas pareciam bem, mas faz alguns dias que o fórum parece “lento” às vezes. Quando digo lento, quero dizer que as solicitações levam algum tempo para serem processadas (enviar respostas, editar, etc.) e, agora mesmo, notei a mesma mensagem novamente.
Fui verificar o painel do Grafana que configurei e vi que o servidor está no limite em termos de uso de CPU.
Um docker stats rápido me mostra isto:
CONTAINER ID   NAME                      CPU %     MEM USAGE / LIMIT     MEM %     NET I/O           BLOCK I/O         PIDS
2c81f3b51e74   app                       800.14%   18.18GiB / 29.38GiB   61.87%    57.1GB / 180GB    31.1TB / 7.45TB   282
5164921ee233   grafana                   0.05%     98.36MiB / 29.38GiB   0.33%     2.05GB / 284MB    7.26GB / 6.17GB   17
400e496902d7   prometheus                0.67%     139.1MiB / 29.38GiB   0.46%     101GB / 3.82GB    28GB / 27.6GB     14
e2af5bfa922f   blackbox_exporter         0.00%     13.71MiB / 29.38GiB   0.05%     169MB / 359MB     295MB / 27.4MB    14
581664b0fe9a   docker_state_exporter     8.59%     11.86MiB / 29.38GiB   0.04%     533MB / 8.67GB    65.2MB / 6.16MB   15
408e050e9dc9   discourse_forward_proxy   0.00%     5.926MiB / 29.38GiB   0.02%     40.1GB / 40.1GB   36.8MB / 9.68MB   9
fbba6c927dd8   cadvisor                  9.13%     385.5MiB / 29.38GiB   1.28%     2.25GB / 135GB    85.1GB / 2.65GB   26
8fe73c0019b1   node_exporter             0.00%     10.74MiB / 29.38GiB   0.04%     112MB / 1.84GB    199MB / 2.82MB    8
9b95fa3156bb   matomo_cron               0.00%     4.977MiB / 29.38GiB   0.02%     81.4kB / 0B       49.4GB / 0B       3
553a3e7389eb   matomo_web                0.00%     8.082MiB / 29.38GiB   0.03%     2.15GB / 6.36GB   215MB / 2.36GB    9
adf21bdea1e5   matomo_app                0.01%     78.13MiB / 29.38GiB   0.26%     8.63GB / 3.74GB   59.8GB / 3.07GB   4
96d873027990   matomo_db                 0.06%     36.8MiB / 29.38GiB    0.12%     3.11GB / 5.76GB   4.16GB / 8.35GB   13
Alguma ideia do que pode estar causando isso?
Crius
Julho 12, 2023, 2:37pm
10
Tentei reiniciar o aplicativo, a carga ainda está aumentando na mesma quantidade imediatamente após a reinicialização.
Existe alguma maneira de ver que tipo de processo está usando mais recursos? Tentei verificar o painel do Sidekiq, mas ele apenas me mostra a lista de processos em execução/na fila e o tempo médio de execução, alguns são lentos (levando minutos), mas não consigo ver nada em processamento no momento ou falhando.
Crius
Julho 12, 2023, 5:57pm
11
Estou atualizando tudo para remover qualquer possível problema que estivesse surgindo devido a algum problema com o beta5. Em 3.1.0.beta6 - 6892324767 agora.
Ainda assim, o uso da CPU está anormalmente alto. Geralmente flutua em torno de 60%.
Crius
Julho 13, 2023, 7:40am
13
I already dug a bit into the processes with htop and seems like some unicorn processes are taking a big chunk of cpu for an extended amount of time. Unfortunately I didn’t find a way to get more information about what those unicorn process were working on exactly.
Anyway, here are the output of the suggested commands.
uptime
09:28:59 up 129 days, 17:00, 1 user, load average: 6.43, 7.21, 6.47
free
               total        used        free      shared  buff/cache   available
Mem:        30810676     4448924      972648     4346596    25389104    21623732
Swap:        8388604     2037888     6350716
vmstat 5 5
procs -----------memory---------- ---swap-- -----io---- -system-- ------cpu-----
 r  b   swpd   free   buff  cache   si   so    bi    bo   in   cs us sy id wa st
17  0 2037376 916336 218376 25179252    2    2  1377   368    0    0 13  3 81  1  3
ps auxrc
USER         PID %CPU %MEM    VSZ   RSS TTY      STAT START   TIME COMMAND
www-data 2748758  0.6  0.0  58528  7820 ?        R    Jul12   6:37 nginx
crius    2843826 15.9  1.2 1140392 392100 ?      Rl   Jul12 131:02 ruby
root     3150580  0.1  0.0      0     0 ?        R    09:17   0:01 kworker/u16:0-events_unbound
crius    3155489  0.0  0.0  13196  3676 pts/2    R+   09:29   0:00 ps
ps auxrc
USER PID %CPU %MEM VSZ RSS TTY STAT START TIME COMMAND
root 2 0.0 0.0 0 0 ? S Mar05 0:08 [kthreadd]
root 3 0.0 0.0 0 0 ? I< Mar05 0:00 \_ [rcu_gp]
root 4 0.0 0.0 0 0 ? I< Mar05 0:00 \_ [rcu_par_gp]
root 5 0.0 0.0 0 0 ? I< Mar05 0:00 \_ [slub_flushwq]
root 6 0.0 0.0 0 0 ? I< Mar05 0:00 \_ [netns]
root 8 0.0 0.0 0 0 ? I< Mar05 0:00 \_ [kworker/0:0H-events_highpri]
root 10 0.0 0.0 0 0 ? I< Mar05 0:00 \_ [mm_percpu_wq]
root 11 0.0 0.0 0 0 ? S Mar05 0:00 \_ [rcu_tasks_rude_]
root 12 0.0 0.0 0 0 ? S Mar05 0:00 \_ [rcu_tasks_trace]
root 13 0.0 0.0 0 0 ? S Mar05 18:43 \_ [ksoftirqd/0]
root 14 0.2 0.0 0 0 ? I Mar05 451:57 \_ [rcu_sched]
root 15 0.0 0.0 0 0 ? S Mar05 1:15 \_ [migration/0]
root 16 0.0 0.0 0 0 ? S Mar05 0:00 \_ [idle_inject/0]
root 18 0.0 0.0 0 0 ? S Mar05 0:00 \_ [cpuhp/0]
root 19 0.0 0.0 0 0 ? S Mar05 0:00 \_ [cpuhp/1]
root 20 0.0 0.0 0 0 ? S Mar05 0:00 \_ [idle_inject/1]
root 21 0.0 0.0 0 0 ? S Mar05 1:16 \_ [migration/1]
root 22 0.0 0.0 0 0 ? S Mar05 13:06 \_ [ksoftirqd/1]
root 24 0.0 0.0 0 0 ? I< Mar05 0:00 \_ [kworker/1:0H-events_highpri]
root 25 0.0 0.0 0 0 ? S Mar05 0:00 \_ [cpuhp/2]
root 26 0.0 0.0 0 0 ? S Mar05 0:00 \_ [idle_inject/2]
root 27 0.0 0.0 0 0 ? S Mar05 1:17 \_ [migration/2]
root 28 0.0 0.0 0 0 ? S Mar05 11:42 \_ [ksoftirqd/2]
root 30 0.0 0.0 0 0 ? I< Mar05 0:00 \_ [kworker/2:0H-events_highpri]
root 31 0.0 0.0 0 0 ? S Mar05 0:00 \_ [cpuhp/3]
root 32 0.0 0.0 0 0 ? S Mar05 0:00 \_ [idle_inject/3]
root 33 0.0 0.0 0 0 ? S Mar05 1:17 \_ [migration/3]
root 34 0.0 0.0 0 0 ? S Mar05 9:55 \_ [ksoftirqd/3]
root 36 0.0 0.0 0 0 ? I< Mar05 0:00 \_ [kworker/3:0H-events_highpri]
root 37 0.0 0.0 0 0 ? S Mar05 0:00 \_ [cpuhp/4]
root 38 0.0 0.0 0 0 ? S Mar05 0:00 \_ [idle_inject/4]
root 39 0.0 0.0 0 0 ? S Mar05 1:17 \_ [migration/4]
root 40 0.0 0.0 0 0 ? S Mar05 9:16 \_ [ksoftirqd/4]
root 42 0.0 0.0 0 0 ? I< Mar05 0:00 \_ [kworker/4:0H-kblockd]
root 43 0.0 0.0 0 0 ? S Mar05 0:00 \_ [cpuhp/5]
root 44 0.0 0.0 0 0 ? S Mar05 0:00 \_ [idle_inject/5]
root 45 0.0 0.0 0 0 ? S Mar05 1:23 \_ [migration/5]
root 46 0.1 0.0 0 0 ? S Mar05 359:36 \_ [ksoftirqd/5]
root 48 0.0 0.0 0 0 ? I< Mar05 0:00 \_ [kworker/5:0H-events_highpri]
root 49 0.0 0.0 0 0 ? S Mar05 0:00 \_ [cpuhp/6]
root 50 0.0 0.0 0 0 ? S Mar05 0:00 \_ [idle_inject/6]
root 51 0.0 0.0 0 0 ? S Mar05 1:18 \_ [migration/6]
root 52 0.0 0.0 0 0 ? S Mar05 9:10 \_ [ksoftirqd/6]
root 54 0.0 0.0 0 0 ? I< Mar05 0:00 \_ [kworker/6:0H-events_highpri]
root 55 0.0 0.0 0 0 ? S Mar05 0:00 \_ [cpuhp/7]
root 56 0.0 0.0 0 0 ? S Mar05 0:00 \_ [idle_inject/7]
root 57 0.0 0.0 0 0 ? S Mar05 1:28 \_ [migration/7]
root 58 0.0 0.0 0 0 ? S Mar05 37:46 \_ [ksoftirqd/7]
root 60 0.0 0.0 0 0 ? I< Mar05 0:00 \_ [kworker/7:0H-events_highpri]
root 61 0.0 0.0 0 0 ? S Mar05 0:00 \_ [kdevtmpfs]
root 62 0.0 0.0 0 0 ? I< Mar05 0:00 \_ [inet_frag_wq]
root 63 0.0 0.0 0 0 ? S Mar05 0:00 \_ [kauditd]
root 66 0.0 0.0 0 0 ? S Mar05 1:14 \_ [khungtaskd]
root 67 0.0 0.0 0 0 ? S Mar05 0:00 \_ [oom_reaper]
root 68 0.0 0.0 0 0 ? I< Mar05 0:00 \_ [writeback]
root 69 0.1 0.0 0 0 ? S Mar05 246:13 \_ [kcompactd0]
root 70 0.0 0.0 0 0 ? SN Mar05 0:00 \_ [ksmd]
root 71 0.0 0.0 0 0 ? SN Mar05 12:39 \_ [khugepaged]
root 118 0.0 0.0 0 0 ? I< Mar05 0:00 \_ [kintegrityd]
root 119 0.0 0.0 0 0 ? I< Mar05 0:00 \_ [kblockd]
root 120 0.0 0.0 0 0 ? I< Mar05 0:00 \_ [blkcg_punt_bio]
root 122 0.0 0.0 0 0 ? I< Mar05 0:00 \_ [tpm_dev_wq]
root 123 0.0 0.0 0 0 ? I< Mar05 0:00 \_ [ata_sff]
root 124 0.0 0.0 0 0 ? I< Mar05 0:00 \_ [md]
root 125 0.0 0.0 0 0 ? I< Mar05 0:00 \_ [edac-poller]
root 126 0.0 0.0 0 0 ? I< Mar05 0:00 \_ [devfreq_wq]
root 127 0.0 0.0 0 0 ? S Mar05 0:00 \_ [watchdogd]
root 129 0.0 0.0 0 0 ? I< Mar05 5:55 \_ [kworker/7:1H-kblockd]
root 131 0.2 0.0 0 0 ? S Mar05 429:02 \_ [kswapd0]
root 132 0.0 0.0 0 0 ? S Mar05 0:00 \_ [ecryptfs-kthrea]
root 134 0.0 0.0 0 0 ? I< Mar05 0:00 \_ [kthrotld]
root 135 0.0 0.0 0 0 ? I< Mar05 0:00 \_ [acpi_thermal_pm]
root 137 0.0 0.0 0 0 ? S Mar05 0:00 \_ [scsi_eh_0]
root 138 0.0 0.0 0 0 ? I< Mar05 0:00 \_ [scsi_tmf_0]
root 139 0.0 0.0 0 0 ? S Mar05 0:00 \_ [scsi_eh_1]
root 140 0.0 0.0 0 0 ? I< Mar05 0:00 \_ [scsi_tmf_1]
root 142 0.0 0.0 0 0 ? I< Mar05 0:00 \_ [vfio-irqfd-clea]
root 144 0.0 0.0 0 0 ? I< Mar05 0:00 \_ [mld]
root 145 0.0 0.0 0 0 ? R< Mar05 5:51 \_ [kworker/2:1H+kblockd]
root 146 0.0 0.0 0 0 ? I< Mar05 0:00 \_ [ipv6_addrconf]
root 159 0.0 0.0 0 0 ? I< Mar05 0:00 \_ [kstrp]
root 162 0.0 0.0 0 0 ? I< Mar05 0:00 \_ [zswap-shrink]
root 163 0.0 0.0 0 0 ? I< Mar05 0:00 \_ [kworker/u17:0]
root 168 0.0 0.0 0 0 ? I< Mar05 0:00 \_ [charger_manager]
root 215 0.0 0.0 0 0 ? S Mar05 0:00 \_ [scsi_eh_2]
root 217 0.0 0.0 0 0 ? I< Mar05 0:00 \_ [scsi_tmf_2]
root 223 0.0 0.0 0 0 ? I< Mar05 4:55 \_ [kworker/3:1H-kblockd]
root 224 0.0 0.0 0 0 ? I< Mar05 5:34 \_ [kworker/1:1H-kblockd]
root 245 0.0 0.0 0 0 ? S Mar05 29:40 \_ [jbd2/sda3-8]
root 246 0.0 0.0 0 0 ? I< Mar05 0:00 \_ [ext4-rsv-conver]
root 275 0.0 0.0 0 0 ? I< Mar05 4:41 \_ [kworker/6:1H-kblockd]
root 277 0.0 0.0 0 0 ? I< Mar05 6:23 \_ [kworker/5:1H-kblockd]
root 308 0.0 0.0 0 0 ? I< Mar05 4:43 \_ [kworker/4:1H-kblockd]
root 326 0.0 0.0 0 0 ? I< Mar05 5:55 \_ [kworker/0:1H-kblockd]
root 364 0.0 0.0 0 0 ? I< Mar05 0:00 \_ [cryptd]
root 395 0.0 0.0 0 0 ? S Mar05 0:00 \_ [jbd2/sda2-8]
root 396 0.0 0.0 0 0 ? I< Mar05 0:00 \_ [ext4-rsv-conver]
root 2698602 0.0 0.0 0 0 ? I Jul12 0:17 \_ [kworker/6:2-mm_percpu_wq]
root 2747634 0.0 0.0 0 0 ? I Jul12 0:06 \_ [kworker/4:0-mm_percpu_wq]
root 2849036 0.0 0.0 0 0 ? I Jul12 0:01 \_ [kworker/7:0-events]
root 2998275 0.0 0.0 0 0 ? I 02:24 0:01 \_ [kworker/5:1-mm_percpu_wq]
root 3028302 0.0 0.0 0 0 ? I 03:47 0:01 \_ [kworker/2:0-cgroup_destroy]
root 3033583 0.0 0.0 0 0 ? I 04:01 0:04 \_ [kworker/7:1-mm_percpu_wq]
root 3050837 0.0 0.0 0 0 ? I 04:48 0:03 \_ [kworker/3:2-events]
root 3092947 0.1 0.0 0 0 ? I 06:44 0:11 \_ [kworker/0:2-events]
root 3093859 0.0 0.0 0 0 ? I 06:46 0:02 \_ [kworker/2:2-events]
root 3102726 0.1 0.0 0 0 ? I 07:10 0:11 \_ [kworker/u16:3-ext4-rsv-conversion]
root 3112088 0.0 0.0 0 0 ? I 07:35 0:02 \_ [kworker/1:0-rcu_gp]
root 3120728 0.0 0.0 0 0 ? I 07:59 0:00 \_ [kworker/6:1]
root 3131601 0.0 0.0 0 0 ? I 08:26 0:00 \_ [kworker/5:0-events]
root 3144423 0.0 0.0 0 0 ? I 09:01 0:00 \_ [kworker/3:0-mm_percpu_wq]
root 3145746 0.0 0.0 0 0 ? I 09:04 0:00 \_ [kworker/4:2]
root 3150580 0.1 0.0 0 0 ? I 09:17 0:01 \_ [kworker/u16:0-writeback]
root 3150760 0.0 0.0 0 0 ? I 09:17 0:00 \_ [kworker/1:2-mm_percpu_wq]
root 3153525 0.0 0.0 0 0 ? I 09:24 0:00 \_ [kworker/0:0]
root 3155513 0.0 0.0 0 0 ? I 09:29 0:00 \_ [kworker/u16:1-events_power_efficient]
root 1 0.0 0.0 167316 7212 ? Ss Mar05 31:01 /sbin/init
root 282 0.0 0.1 80784 31204 ? S<s Mar05 49:18 /lib/systemd/systemd-journald
root 330 0.0 0.0 25224 1728 ? Ss Mar05 1:14 /lib/systemd/systemd-udevd
systemd+ 434 0.0 0.0 89356 236 ? Ssl Mar05 1:09 /lib/systemd/systemd-timesyncd
root 478 0.0 0.0 240256 1492 ? Ssl Mar05 19:27 /usr/libexec/accounts-daemon
root 479 0.0 0.0 9492 676 ? Ss Mar05 1:08 /usr/sbin/cron -f -P
message+ 480 0.0 0.0 8904 1524 ? Ss Mar05 2:27 @dbus-daemon --system --address=systemd: --nofork --nopidfile --systemd-a
root 486 0.0 0.0 82768 960 ? Ssl Mar05 10:09 /usr/sbin/irqbalance --foreground
root 487 0.0 0.0 35776 5368 ? Ss Mar05 0:10 /usr/bin/python3 /usr/bin/networkd-dispatcher --run-startup-triggers
root 492 0.0 0.0 15896 2508 ? Ss Mar05 1:40 /lib/systemd/systemd-logind
root 527 0.0 0.0 234484 1460 ? Ssl Mar05 0:05 /usr/libexec/polkitd --no-debug
systemd+ 574 0.0 0.0 16500 2744 ? Ss Mar05 4:20 /lib/systemd/systemd-networkd
systemd+ 576 0.0 0.0 25664 2876 ? Ss Mar05 8:36 /lib/systemd/systemd-resolved
root 580 0.0 0.0 112444 1280 ? Ssl Mar05 0:00 /usr/bin/python3 /usr/share/unattended-upgrades/unattended-upgrade-shutdo
root 581 0.2 0.0 1801740 21140 ? Ssl Mar05 556:09 /usr/bin/containerd
root 585 0.0 0.0 8772 88 tty1 Ss+ Mar05 0:00 /sbin/agetty -o -p -- \u --noclear tty1 linux
root 586 0.0 0.0 15424 2504 ? Ss Mar05 23:48 sshd: /usr/sbin/sshd -D [listener] 0 of 10-100 startups
root 3155109 0.0 0.0 17052 10628 ? Ss 09:28 0:00 \_ sshd: crius [priv]
crius 3155148 0.0 0.0 17188 7928 ? S 09:28 0:00 \_ sshd: crius@pts/2
crius 3155149 0.1 0.0 11412 5340 pts/2 Ss 09:28 0:00 \_ -bash
crius 3155643 0.0 0.0 13576 4128 pts/2 R+ 09:30 0:00 \_ ps auxf
root 623 0.4 0.1 2417520 54884 ? Ssl Mar05 840:05 /usr/bin/dockerd -H fd:// --containerd=/run/containerd/containerd.sock
root 2890936 0.0 0.0 1157000 844 ? Sl May14 0:22 \_ /usr/bin/docker-proxy -proto tcp -host-ip 0.0.0.0 -host-port 2053 -co
root 2344276 0.0 0.0 1083012 740 ? Sl Jun12 0:11 \_ /usr/bin/docker-proxy -proto tcp -host-ip 0.0.0.0 -host-port 9090 -co
root 2374753 0.0 0.0 1083268 908 ? Sl Jun12 0:12 \_ /usr/bin/docker-proxy -proto tcp -host-ip 0.0.0.0 -host-port 8443 -co
root 2748545 0.0 0.0 1304208 692 ? Sl Jul12 0:00 \_ /usr/bin/docker-proxy -proto tcp -host-ip 0.0.0.0 -host-port 443 -con
root 2748566 0.0 0.0 1230988 704 ? Sl Jul12 0:00 \_ /usr/bin/docker-proxy -proto tcp -host-ip 0.0.0.0 -host-port 80 -cont
root 1674 0.0 0.0 298144 2608 ? Ssl Mar05 2:11 /usr/libexec/packagekitd
crius 1442337 0.0 0.0 17396 4392 ? Ss Mar09 14:47 /lib/systemd/systemd --user
crius 1442338 0.0 0.0 169832 300 ? S Mar09 0:00 \_ (sd-pam)
crius 1442416 0.0 0.0 10048 600 ? Ss Mar09 0:00 SCREEN -S ngi_avatar_migration
crius 1442417 0.0 0.0 11284 952 pts/1 Ss+ Mar09 0:00 \_ /bin/bash
crius 2539604 0.0 0.0 730088 5076 ? Sl May13 12:18 /home/crius/.docker/cli-plugins/docker-compose compose up
crius 2543461 0.0 0.0 729832 4092 ? Sl May13 12:41 /home/crius/.docker/cli-plugins/docker-compose compose up
crius 2546257 0.0 0.0 730344 4704 ? Sl May14 12:03 /home/crius/.docker/cli-plugins/docker-compose compose up
root 2890626 0.0 0.0 720756 3528 ? Sl May14 18:49 /usr/bin/containerd-shim-runc-v2 -namespace moby -id 96d87302799096e81906
systemd+ 2890647 0.1 0.1 2391320 39520 ? Ssl May14 117:20 \_ mariadbd --max-allowed-packet=64MB
root 2890739 0.0 0.0 720756 3804 ? Sl May14 25:15 /usr/bin/containerd-shim-runc-v2 -namespace moby -id adf21bdea1e5b2ae1324
root 2890764 0.0 0.0 203348 3348 ? Ss May14 10:22 \_ php-fpm: master process (/usr/local/etc/php-fpm.conf)
82 2723195 0.4 0.1 228180 47224 ? S Jul12 4:24 \_ php-fpm: pool www
82 2915709 0.2 0.1 219164 39312 ? S Jul12 1:32 \_ php-fpm: pool www
82 2915722 0.2 0.1 224888 44924 ? S Jul12 1:27 \_ php-fpm: pool www
root 2890959 0.0 0.0 720756 2524 ? Sl May14 18:43 /usr/bin/containerd-shim-runc-v2 -namespace moby -id 553a3e7389eb5c8433ef
root 2890983 0.0 0.0 8008 384 ? Ss May14 0:00 \_ nginx: master process nginx -g daemon off;
systemd+ 2891099 0.0 0.0 9008 2736 ? S May14 8:04 \_ nginx: worker process
systemd+ 2891100 0.0 0.0 9128 2980 ? S May14 8:05 \_ nginx: worker process
systemd+ 2891101 0.0 0.0 9064 2816 ? S May14 7:59 \_ nginx: worker process
systemd+ 2891102 0.0 0.0 8952 2912 ? S May14 8:05 \_ nginx: worker process
systemd+ 2891103 0.0 0.0 9016 2672 ? S May14 8:00 \_ nginx: worker process
systemd+ 2891104 0.0 0.0 9176 2820 ? S May14 8:00 \_ nginx: worker process
systemd+ 2891105 0.0 0.0 9104 2728 ? S May14 8:00 \_ nginx: worker process
systemd+ 2891106 0.0 0.0 9064 2772 ? S May14 8:03 \_ nginx: worker process
root 2913104 0.0 0.0 721012 4236 ? Sl May14 19:44 /usr/bin/containerd-shim-runc-v2 -namespace moby -id 9b95fa3156bba900a592
root 2913124 0.0 0.0 3896 224 ? Ss May14 0:00 \_ bash -c bash -s <<EOF trap "break;exit" SIGHUP SIGINT SIGTERM while /
root 2913193 0.0 0.0 3896 720 ? S May14 0:04 \_ bash -s
root 3145448 0.0 0.0 2392 428 ? S 09:03 0:00 \_ sleep 3600
root 727413 0.0 0.0 720756 3328 ? Sl May18 18:14 /usr/bin/containerd-shim-runc-v2 -namespace moby -id 581664b0fe9ab6478cb9
root 727452 1.0 0.0 716432 15932 ? Ssl May18 866:43 \_ /go/bin/docker_state_exporter -listen-address=:8080
root 727445 0.0 0.0 720500 4024 ? Sl May18 18:31 /usr/bin/containerd-shim-runc-v2 -namespace moby -id 8fe73c0019b1e003d040
nobody 727472 0.0 0.0 727104 12732 ? Ssl May18 58:50 \_ /bin/node_exporter --path.rootfs=/host
root 727504 0.0 0.0 720756 5208 ? Sl May18 46:22 /usr/bin/containerd-shim-runc-v2 -namespace moby -id fbba6c927dd83c1a7960
root 727564 10.3 0.2 215116 72624 ? Ssl May18 8372:45 \_ /usr/bin/cadvisor -logtostderr
root 727546 0.0 0.0 720756 2844 ? Sl May18 19:57 /usr/bin/containerd-shim-runc-v2 -namespace moby -id 408e050e9dc9b779f439
root 727574 0.0 0.0 9072 532 ? Ss May18 0:00 \_ nginx: master process nginx -g daemon off;
systemd+ 727820 0.0 0.0 9604 2800 ? S May18 1:28 \_ nginx: worker process
systemd+ 727821 0.0 0.0 9604 2768 ? S May18 1:29 \_ nginx: worker process
systemd+ 727823 0.0 0.0 9604 2844 ? S May18 1:24 \_ nginx: worker process
systemd+ 727824 0.0 0.0 9604 2800 ? S May18 1:21 \_ nginx: worker process
systemd+ 727825 0.0 0.0 9604 2784 ? S May18 1:20 \_ nginx: worker process
systemd+ 727826 0.0 0.0 9604 2576 ? S May18 1:16 \_ nginx: worker process
systemd+ 727827 0.0 0.0 9604 2828 ? S May18 1:16 \_ nginx: worker process
systemd+ 727828 0.0 0.0 9604 2820 ? S May18 1:17 \_ nginx: worker process
root 3271398 0.0 0.0 720756 3844 ? Sl May22 16:10 /usr/bin/containerd-shim-runc-v2 -namespace moby -id e2af5bfa922f8b3513bb
root 3271418 0.0 0.0 727512 14900 ? Ssl May22 40:12 \_ /bin/blackbox_exporter --config.file=/config/blackbox.yaml
syslog 3680620 0.0 0.0 222404 2844 ? Ssl May23 6:29 /usr/sbin/rsyslogd -n -iNONE
root 3683957 0.0 0.0 41328 2772 ? Ss May23 0:43 /usr/lib/postfix/sbin/master -w
postfix 2748725 0.0 0.0 41592 5228 ? S Jul12 0:00 \_ qmgr -l -t unix -u
postfix 3146384 0.0 0.0 41548 6652 ? S 09:05 0:00 \_ pickup -l -t unix -u -c
root 2344320 0.0 0.0 720500 4204 ? Sl Jun12 11:48 /usr/bin/containerd-shim-runc-v2 -namespace moby -id 400e496902d765603a25
nobody 2344347 1.1 0.5 2905480 155696 ? Rsl Jun12 502:21 \_ /bin/prometheus --config.file=/app.cfg/prometheus.yaml --storage.tsdb
root 2374785 0.0 0.0 720500 2976 ? Sl Jun12 12:15 /usr/bin/containerd-shim-runc-v2 -namespace moby -id 5164921ee23304d40f4b
472 2374814 0.6 0.3 883336 93316 ? Ssl Jun12 305:17 \_ grafana server --homepath=/usr/share/grafana --config=/etc/grafana/gr
root 2748589 0.0 0.0 720500 3308 ? Sl Jul12 0:24 /usr/bin/containerd-shim-runc-v2 -namespace moby -id 2c81f3b51e743cb2a695
root 2748621 0.0 0.0 6964 332 ? Ss+ Jul12 0:00 \_ /bin/bash /sbin/boot
root 2748731 0.0 0.0 2400 8 ? S+ Jul12 0:02 \_ /usr/bin/runsvdir -P /etc/service
root 2748732 0.0 0.0 2248 208 ? Ss Jul12 0:00 | \_ runsv cron
root 2748738 0.0 0.0 6680 916 ? S Jul12 0:01 | | \_ cron -f
root 2748733 0.0 0.0 2248 16 ? Ss Jul12 0:00 | \_ runsv rsyslog
root 2748741 0.0 0.0 151124 200 ? Sl Jul12 0:00 | | \_ rsyslogd -n
root 2748734 0.0 0.0 2248 108 ? Ss Jul12 0:00 | \_ runsv postgres
root 2748740 0.0 0.0 2396 152 ? S Jul12 0:06 | | \_ svlogd /var/log/postgres
systemd+ 2748751 0.3 0.3 4387564 97536 ? S Jul12 3:50 | | \_ /usr/lib/postgresql/13/bin/postmaster -D /etc/postgresql/
systemd+ 2748817 0.3 13.8 4389228 4261892 ? Ss Jul12 3:27 | | \_ postgres: 13/main: checkpointer
systemd+ 2748818 0.3 13.8 4387696 4254112 ? Ss Jul12 3:11 | | \_ postgres: 13/main: background writer
systemd+ 2748819 0.3 0.0 4387564 18768 ? Ss Jul12 3:59 | | \_ postgres: 13/main: walwriter
systemd+ 2748820 0.0 0.0 4388108 4804 ? Ss Jul12 0:02 | | \_ postgres: 13/main: autovacuum launcher
systemd+ 2748821 0.5 0.0 67860 2520 ? Ss Jul12 6:01 | | \_ postgres: 13/main: stats collector
systemd+ 2748822 0.0 0.0 4388120 3328 ? Ss Jul12 0:00 | | \_ postgres: 13/main: logical replication launcher
systemd+ 2843545 0.0 0.3 4399008 109852 ? Ss Jul12 0:02 | | \_ postgres: 13/main: discourse discourse [local] idle
systemd+ 2843992 0.0 3.0 4405064 928824 ? Ss Jul12 0:03 | | \_ postgres: 13/main: discourse discourse [local] idle
systemd+ 2852883 0.0 0.8 4396836 272064 ? Ss Jul12 0:04 | | \_ postgres: 13/main: discourse discourse [local] idle
systemd+ 2852884 0.0 7.5 4405456 2335560 ? Ss Jul12 0:08 | | \_ postgres: 13/main: discourse discourse [local] idle
systemd+ 2852887 0.0 7.1 4405764 2189764 ? Ss Jul12 0:11 | | \_ postgres: 13/main: discourse discourse [local] idle
systemd+ 2899553 0.0 2.2 4397092 691820 ? Ss Jul12 0:13 | | \_ postgres: 13/main: discourse discourse [local] idle
systemd+ 3037776 3.3 14.1 4526944 4346572 ? Ss 04:12 10:34 | | \_ postgres: 13/main: discourse discourse [local] idle
systemd+ 3064125 0.0 0.9 4395760 306864 ? Ss 05:25 0:01 | | \_ postgres: 13/main: discourse discourse [local] idle
systemd+ 3114121 2.0 13.0 4519752 4027320 ? Ss 07:41 2:11 | | \_ postgres: 13/main: discourse discourse [local] idle
systemd+ 3116277 2.7 13.0 4519504 4030420 ? Ss 07:47 2:48 | | \_ postgres: 13/main: discourse discourse [local] idle
systemd+ 3116411 3.9 13.5 4517844 4173364 ? Ss 07:47 4:04 | | \_ postgres: 13/main: discourse discourse [local] idle
systemd+ 3117196 1.4 12.9 4515768 3982940 ? Ss 07:49 1:28 | | \_ postgres: 13/main: discourse discourse [local] idle
systemd+ 3117708 2.1 13.1 4517008 4057736 ? Ss 07:50 2:09 | | \_ postgres: 13/main: discourse discourse [local] idle
systemd+ 3118017 4.8 13.8 4526084 4260840 ? Ss 07:51 4:45 | | \_ postgres: 13/main: discourse discourse [local] idle
systemd+ 3118048 3.2 13.3 4525892 4111704 ? Ss 07:51 3:14 | | \_ postgres: 13/main: discourse discourse [local] idle
systemd+ 3128686 0.7 6.1 4405988 1909256 ? Ss 08:19 0:30 | | \_ postgres: 13/main: discourse discourse [local] idle
systemd+ 3128687 0.7 6.6 4398936 2052828 ? Ss 08:19 0:30 | | \_ postgres: 13/main: discourse discourse [local] idle
systemd+ 3130657 0.9 6.8 4405580 2113692 ? Ss 08:24 0:37 | | \_ postgres: 13/main: discourse discourse [local] idle
systemd+ 3134864 1.2 6.1 4405228 1908596 ? Ss 08:35 0:40 | | \_ postgres: 13/main: discourse discourse [local] idle
systemd+ 3134893 0.8 4.5 4405496 1389992 ? Ss 08:35 0:29 | | \_ postgres: 13/main: discourse discourse [local] idle
systemd+ 3144272 1.4 4.5 4405884 1412496 ? Ss 09:00 0:25 | | \_ postgres: 13/main: discourse discourse [local] idle
systemd+ 3144691 1.0 8.2 4406004 2554024 ? Ss 09:01 0:17 | | \_ postgres: 13/main: discourse discourse [local] idle
systemd+ 3147010 1.3 5.2 4405288 1619456 ? Ss 09:07 0:19 | | \_ postgres: 13/main: discourse discourse [local] idle
systemd+ 3154498 0.4 0.9 4398792 304316 ? Ss 09:27 0:00 | | \_ postgres: 13/main: discourse discourse [local] idle
systemd+ 3155429 0.3 0.2 4390740 72012 ? Ss 09:29 0:00 | | \_ postgres: 13/main: discourse discourse [local] idle
systemd+ 3155430 0.5 0.6 4390000 199852 ? Ss 09:29 0:00 | | \_ postgres: 13/main: discourse discourse [local] idle
systemd+ 3155431 0.1 0.3 4389928 104328 ? Ss 09:29 0:00 | | \_ postgres: 13/main: discourse discourse [local] idle
systemd+ 3155435 0.2 0.2 4389760 62116 ? Ss 09:29 0:00 | | \_ postgres: 13/main: discourse discourse [local] idle
root 2748735 0.0 0.0 2248 4 ? Ss Jul12 0:00 | \_ runsv unicorn
crius 2748742 0.1 0.0 15316 2496 ? S Jul12 2:01 | | \_ /bin/bash config/unicorn_launcher -E production -c config
crius 3155642 0.0 0.0 13820 2164 ? S 09:30 0:00 | | \_ sleep 1
root 2748736 0.0 0.0 2248 124 ? Ss Jul12 0:00 | \_ runsv nginx
root 2748739 0.0 0.0 53344 604 ? S Jul12 0:00 | | \_ nginx: master process /usr/sbin/nginx
www-data 2748754 0.6 0.0 58380 8120 ? S Jul12 6:57 | | \_ nginx: worker process
www-data 2748755 0.6 0.0 58376 8664 ? S Jul12 6:55 | | \_ nginx: worker process
www-data 2748756 0.6 0.0 58356 8136 ? S Jul12 6:51 | | \_ nginx: worker process
www-data 2748757 0.6 0.0 59308 8080 ? S Jul12 6:41 | | \_ nginx: worker process
www-data 2748758 0.6 0.0 58528 7820 ? S Jul12 6:37 | | \_ nginx: worker process
www-data 2748759 0.6 0.0 58272 8208 ? S Jul12 6:51 | | \_ nginx: worker process
www-data 2748760 0.6 0.0 59100 8600 ? S Jul12 6:47 | | \_ nginx: worker process
www-data 2748761 0.6 0.0 58532 8188 ? S Jul12 6:50 | | \_ nginx: worker process
www-data 2748762 0.0 0.0 53540 588 ? S Jul12 0:01 | | \_ nginx: cache manager process
root 2748737 0.0 0.0 2248 44 ? Ss Jul12 0:00 | \_ runsv redis
root 2748743 0.0 0.0 2396 16 ? S Jul12 0:00 | \_ svlogd /var/log/redis
message+ 2748750 4.1 0.2 293132 68876 ? Sl Jul12 42:44 | \_ /usr/bin/redis-server *:6379
crius 2843290 0.1 1.0 696992 310896 ? Sl Jul12 1:27 \_ unicorn master -E production -c config/unicorn.conf.rb
crius 2843716 3.6 1.1 1481356 368076 ? SNl Jul12 29:41 | \_ sidekiq 6.5.9 discourse [0 of 5 busy]
crius 2843729 1.7 0.7 1019336 232084 ? Sl Jul12 14:44 | \_ discourse prometheus-global-reporter
crius 2843769 27.3 1.3 1227948 417356 ? Rl Jul12 224:30 | \_ unicorn worker[0] -E production -c config/unicorn.conf.rb
crius 2843826 15.9 1.2 1140968 397560 ? Rl Jul12 131:12 | \_ unicorn worker[2] -E production -c config/unicorn.conf.rb
crius 2843891 9.5 1.1 1114024 353860 ? Rl Jul12 78:12 | \_ unicorn worker[4] -E production -c config/unicorn.conf.rb
crius 2843918 7.1 1.2 1142248 383800 ? Rl Jul12 58:40 | \_ unicorn worker[5] -E production -c config/unicorn.conf.rb
crius 2843965 5.7 1.0 1074792 336012 ? Rl Jul12 47:22 | \_ unicorn worker[6] -E production -c config/unicorn.conf.rb
crius 2844114 1.3 0.1 297232 39440 ? Sl Jul12 11:25 | \_ discourse prometheus-collector
crius 2844577 4.8 1.1 1121000 365044 ? Rl Jul12 40:05 | \_ unicorn worker[7] -E production -c config/unicorn.conf.rb
crius 2844866 4.4 1.0 1129704 328864 ? Rl Jul12 36:14 | \_ unicorn worker[1] -E production -c config/unicorn.conf.rb
crius 2902401 3.2 1.1 1214056 340712 ? Rl Jul12 22:10 | \_ unicorn worker[3] -E production -c config/unicorn.conf.rb
root 3155591 0.1 0.0 2388 76 ? Ss 09:30 0:00 \_ /usr/sbin/anacron -s
Crius
Julho 13, 2023, 8:18am
14
Reiniciei o VPS também, só para o caso de haver algo estranho acontecendo (duvido, já que começou repentinamente ontem após 150 dias de funcionamento), mas não, o mesmo comportamento.
É algum processo de unicórnio consumindo todos os recursos da CPU. Existe alguma maneira de obter mais informações sobre o que esses unicórnios estão fazendo por lá?
Crius
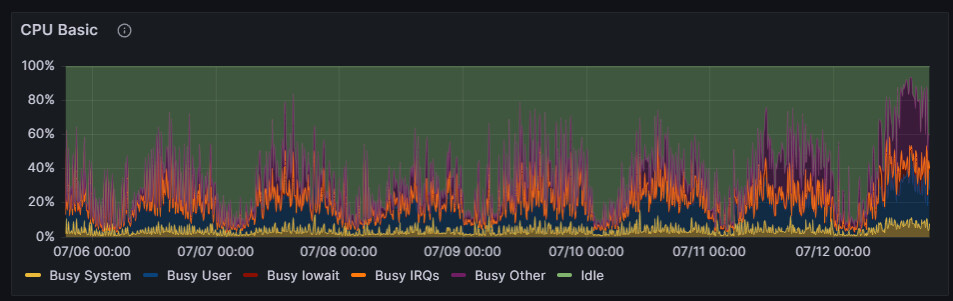
Julho 13, 2023, 8:34am
15
Para uma olhada rápida, claro que oscila, mas esta é a média para trabalhadores de unicórnio em execução, o que me parece anormal quando está em andamento desde o dia anterior:
Falco
Julho 13, 2023, 12:57pm
16
Sua média de carga \u003e 8 em uma máquina de 8 vCPUs significa que seu servidor está sobrecarregado.
Entre 8 unicorns, muitos pids do PostgreSQL e todo o resto do seu servidor, ele não consegue processar as solicitações recebidas rápido o suficiente. Pelo menos você tem bastante memória
É meio incomum o Discourse ficar limitado na CPU do unicorn assim. Na maioria das vezes que vi isso acontecer, foi por causa de um plugin mal comportado. Você pode compartilhar seu app.yml?
Por favor, compartilhe também os resultados do MiniProfiler ao carregar sua página inicial e a página de um tópico.
Crius
Julho 13, 2023, 4:38pm
17
Pedi à hospedagem para investigar se estamos tendo o tempo de CPU roubado por outros VPS em nosso host, pois é muito estranho que isso tenha acontecido tão repentinamente sem que nada realmente mudasse do nosso lado.
Estou aguardando o suporte técnico retornar com alguns resultados.
Falco
Julho 13, 2023, 5:02pm
18
Parece que esta captura de tela corta os rótulos das colunas, mas se um dos 3 primeiros for uma média, você acertou o problema.
Ed_S
Julho 13, 2023, 5:56pm
19
Obrigado pelas saídas. Para referência, a primeira linha de estatísticas do vmstat não é muito útil - todas as cinco linhas dão a imagem necessária.
Crius
Julho 21, 2023, 7:57am
20
Desculpe, esqueci de atualizar aqui.
No final, foi como eu suspeitava. Outro VPS foi implantado no host e estava o sobrecarregando.
Parabéns à Contabo
Gostaria de pedir aos moderadores que deixassem estas últimas respostas aqui, mesmo que não estejam relacionadas ao “discourse”, pois podem ajudar outros a identificar outros motivos pelos quais sua instância pode ter problemas.