您好,
自从几天前我上次更新 discourse 后,这条消息几乎一直弹出。
如果不是因为……这是不正确的,我本来不会在这里开帖。
消息出现了,但您可以像登录一样浏览论坛,没有任何内容显示您未登录。
检查主机上使用的/可用的资源并没有显示机器过载或类似情况。

有人能帮我理解这条消息是如何触发的吗?这样我就可以开始调查是什么原因导致了这条警告,而实际上并非如此?
这条消息很有意义,您的系统拥有可用资源这一事实,更多地表明配置错误,而不是识别错误。
您有多少 unicorn_workers?
假设主机上没有其他东西,您是否分配了 16 个(每个核心 2 个)?
如果您使用的是本地 Postgres,您的 db_shared_buffers 是多少?
该消息与您分配给 Discourse 的资源有关,而不是 VM/主机的资源。
将 db_shared_buffers 设置为您预留内存的 25%,并将 unicorn 工作进程设置为每个 CPU 2 个。可能需要进行一些微调。
显然,如果您觉得资源池不可靠,您也需要在 VM 外部管理资源。几乎所有运行 Discourse 的人都将其运行在某种 VPS 上。
我不是 discourse 方面的专家,所以我只是运行了安装脚本,因为我记得它应该根据可用的内存/CPU 来设置这些参数。
我已经恢复了测试前的 worker 设置,并会再次检查。
说实话,我们没有遇到过这些设置方面的问题,但它也可能无关或仅部分相关。
我会记住你关于 worker 使用 2 倍核心和数据库共享缓冲区使用保留内存的 25% 的建议。
你说保留内存是指运行容器保留的内存吗?因为容器似乎总是“拥有主机上所有可用的内存”:眼
discourse-setup 的做法是:
# db_shared_buffers:1GB 为 128MB,2GB 为 256MB,或 256MB * GB,最大 4096MB
# UNICORN_WORKERS:2GB 或更少为 2 * GB,或 2 * CPU,最大 8
这里的“最大”可以姑且听之,特别是大型社区将从超出这些数字的收益中受益。
所以是的,在你的情况下,它应该指定最大 8 个工作进程和 4096MB。如果你减少 Discourse 可用的工作进程和共享缓冲区,那么它将在消耗完 VM 上的所有资源之前达到上限。
来自 @mpalmer 的这篇帖子仍然是很好的指导:
[quote=“Crius, post:1, topic:268636, username:Crius”]
自从几天前我上次更新 discourse 后,这条消息几乎一直在弹出。
…
有人能帮我弄清楚这条消息是如何被触发的吗?
[/quote]在我看来,它似乎是在请求排队太久时触发的——换句话说,请求的进入速度快于它们被处理的速度。人们可能会想为什么会有这么多请求,或者为什么处理速度如此之慢。在 Discourse 层面,有一些可调参数,这些参数在本帖中已经讨论过,例如在 Extreme load error 中也有讨论。
在 Linux 层面,我会检查
uptime
free
vmstat 5 5
ps auxrc
更新一下:增加工作进程解决了问题
快速跟进。
从那以后,一切似乎都还好,但有几天论坛有时会感觉“慢”。我说慢是指请求需要一些时间才能处理(提交回复、编辑等),就在刚才我又看到了同样的提示。
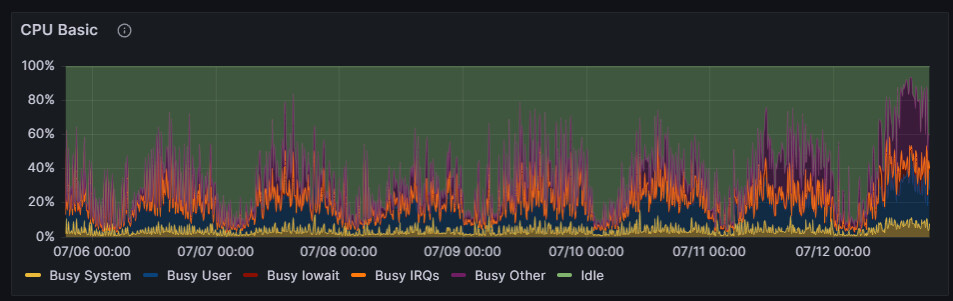
我查看了设置的 Grafana 仪表板,发现服务器的 CPU 使用率已达极限。
快速运行 docker stats 显示如下:
CONTAINER ID   NAME                      CPU %     MEM USAGE / LIMIT     MEM %     NET I/O           BLOCK I/O         PIDS
2c81f3b51e74   app                       800.14%   18.18GiB / 29.38GiB   61.87%    57.1GB / 180GB    31.1TB / 7.45TB   282
5164921ee233   grafana                   0.05%     98.36MiB / 29.38GiB   0.33%     2.05GB / 284MB    7.26GB / 6.17GB   17
400e496902d7   prometheus                0.67%     139.1MiB / 29.38GiB   0.46%     101GB / 3.82GB    28GB / 27.6GB     14
e2af5bfa922f   blackbox_exporter         0.00%     13.71MiB / 29.38GiB   0.05%     169MB / 359MB     295MB / 27.4MB    14
581664b0fe9a   docker_state_exporter     8.59%     11.86MiB / 29.38GiB   0.04%     533MB / 8.67GB    65.2MB / 6.16MB   15
408e050e9dc9   discourse_forward_proxy   0.00%     5.926MiB / 29.38GiB   0.02%     40.1GB / 40.1GB   36.8MB / 9.68MB   9
fbba6c927dd8   cadvisor                  9.13%     385.5MiB / 29.38GiB   1.28%     2.25GB / 135GB    85.1GB / 2.65GB   26
8fe73c0019b1   node_exporter             0.00%     10.74MiB / 29.38GiB   0.04%     112MB / 1.84GB    199MB / 2.82MB    8
9b95fa3156bb   matomo_cron               0.00%     4.977MiB / 29.38GiB   0.02%     81.4kB / 0B       49.4GB / 0B       3
553a3e7389eb   matomo_web                0.00%     8.082MiB / 29.38GiB   0.03%     2.15GB / 6.36GB   215MB / 2.36GB    9
adf21bdea1e5   matomo_app                0.01%     78.13MiB / 29.38GiB   0.26%     8.63GB / 3.74GB   59.8GB / 3.07GB   4
96d873027990   matomo_db                 0.06%     36.8MiB / 29.38GiB    0.12%     3.11GB / 5.76GB   4.16GB / 8.35GB   13
有什么想法可能导致这个问题吗?
重启应用程序后,负载在重启后立即恢复到相同水平。
有没有办法查看是哪种进程占用了大部分资源?我尝试查看 sidekiq 仪表板,但它只显示正在运行/排队的进程列表以及平均执行时间,有些进程很慢(需要几分钟),但我看不到任何正在处理或失败的进程。
还有可能
ps auxf
I already dug a bit into the processes with htop and seems like some unicorn processes are taking a big chunk of cpu for an extended amount of time. Unfortunately I didn’t find a way to get more information about what those unicorn process were working on exactly.
Anyway, here are the output of the suggested commands.
uptime
09:28:59 up 129 days, 17:00, 1 user, load average: 6.43, 7.21, 6.47
free
               total        used        free      shared  buff/cache   available
Mem:        30810676     4448924      972648     4346596    25389104    21623732
Swap:        8388604     2037888     6350716
vmstat 5 5
procs -----------memory---------- ---swap-- -----io---- -system-- ------cpu-----
 r  b   swpd   free   buff  cache   si   so    bi    bo   in   cs us sy id wa st
17  0 2037376 916336 218376 25179252    2    2  1377   368    0    0 13  3 81  1  3
ps auxrc
USER         PID %CPU %MEM    VSZ   RSS TTY      STAT START   TIME COMMAND
www-data 2748758  0.6  0.0  58528  7820 ?        R    Jul12   6:37 nginx
crius    2843826 15.9  1.2 1140392 392100 ?      Rl   Jul12 131:02 ruby
root     3150580  0.1  0.0      0     0 ?        R    09:17   0:01 kworker/u16:0-events_unbound
crius    3155489  0.0  0.0  13196  3676 pts/2    R+   09:29   0:00 ps
ps auxrc
USER PID %CPU %MEM VSZ RSS TTY STAT START TIME COMMAND
root 2 0.0 0.0 0 0 ? S Mar05 0:08 [kthreadd]
root 3 0.0 0.0 0 0 ? I< Mar05 0:00 \_ [rcu_gp]
root 4 0.0 0.0 0 0 ? I< Mar05 0:00 \_ [rcu_par_gp]
root 5 0.0 0.0 0 0 ? I< Mar05 0:00 \_ [slub_flushwq]
root 6 0.0 0.0 0 0 ? I< Mar05 0:00 \_ [netns]
root 8 0.0 0.0 0 0 ? I< Mar05 0:00 \_ [kworker/0:0H-events_highpri]
root 10 0.0 0.0 0 0 ? I< Mar05 0:00 \_ [mm_percpu_wq]
root 11 0.0 0.0 0 0 ? S Mar05 0:00 \_ [rcu_tasks_rude_]
root 12 0.0 0.0 0 0 ? S Mar05 0:00 \_ [rcu_tasks_trace]
root 13 0.0 0.0 0 0 ? S Mar05 18:43 \_ [ksoftirqd/0]
root 14 0.2 0.0 0 0 ? I Mar05 451:57 \_ [rcu_sched]
root 15 0.0 0.0 0 0 ? S Mar05 1:15 \_ [migration/0]
root 16 0.0 0.0 0 0 ? S Mar05 0:00 \_ [idle_inject/0]
root 18 0.0 0.0 0 0 ? S Mar05 0:00 \_ [cpuhp/0]
root 19 0.0 0.0 0 0 ? S Mar05 0:00 \_ [cpuhp/1]
root 20 0.0 0.0 0 0 ? S Mar05 0:00 \_ [idle_inject/1]
root 21 0.0 0.0 0 0 ? S Mar05 1:16 \_ [migration/1]
root 22 0.0 0.0 0 0 ? S Mar05 13:06 \_ [ksoftirqd/1]
root 24 0.0 0.0 0 0 ? I< Mar05 0:00 \_ [kworker/1:0H-events_highpri]
root 25 0.0 0.0 0 0 ? S Mar05 0:00 \_ [cpuhp/2]
root 26 0.0 0.0 0 0 ? S Mar05 0:00 \_ [idle_inject/2]
root 27 0.0 0.0 0 0 ? S Mar05 1:17 \_ [migration/2]
root 28 0.0 0.0 0 0 ? S Mar05 11:42 \_ [ksoftirqd/2]
root 30 0.0 0.0 0 0 ? I< Mar05 0:00 \_ [kworker/2:0H-events_highpri]
root 31 0.0 0.0 0 0 ? S Mar05 0:00 \_ [cpuhp/3]
root 32 0.0 0.0 0 0 ? S Mar05 0:00 \_ [idle_inject/3]
root 33 0.0 0.0 0 0 ? S Mar05 1:17 \_ [migration/3]
root 34 0.0 0.0 0 0 ? S Mar05 9:55 \_ [ksoftirqd/3]
root 36 0.0 0.0 0 0 ? I< Mar05 0:00 \_ [kworker/3:0H-events_highpri]
root 37 0.0 0.0 0 0 ? S Mar05 0:00 \_ [cpuhp/4]
root 38 0.0 0.0 0 0 ? S Mar05 0:00 \_ [idle_inject/4]
root 39 0.0 0.0 0 0 ? S Mar05 1:17 \_ [migration/4]
root 40 0.0 0.0 0 0 ? S Mar05 9:16 \_ [ksoftirqd/4]
root 42 0.0 0.0 0 0 ? I< Mar05 0:00 \_ [kworker/4:0H-kblockd]
root 43 0.0 0.0 0 0 ? S Mar05 0:00 \_ [cpuhp/5]
root 44 0.0 0.0 0 0 ? S Mar05 0:00 \_ [idle_inject/5]
root 45 0.0 0.0 0 0 ? S Mar05 1:23 \_ [migration/5]
root 46 0.1 0.0 0 0 ? S Mar05 359:36 \_ [ksoftirqd/5]
root 48 0.0 0.0 0 0 ? I< Mar05 0:00 \_ [kworker/5:0H-events_highpri]
root 49 0.0 0.0 0 0 ? S Mar05 0:00 \_ [cpuhp/6]
root 50 0.0 0.0 0 0 ? S Mar05 0:00 \_ [idle_inject/6]
root 51 0.0 0.0 0 0 ? S Mar05 1:18 \_ [migration/6]
root 52 0.0 0.0 0 0 ? S Mar05 9:10 \_ [ksoftirqd/6]
root 54 0.0 0.0 0 0 ? I< Mar05 0:00 \_ [kworker/6:0H-events_highpri]
root 55 0.0 0.0 0 0 ? S Mar05 0:00 \_ [cpuhp/7]
root 56 0.0 0.0 0 0 ? S Mar05 0:00 \_ [idle_inject/7]
root 57 0.0 0.0 0 0 ? S Mar05 1:28 \_ [migration/7]
root 58 0.0 0.0 0 0 ? S Mar05 37:46 \_ [ksoftirqd/7]
root 60 0.0 0.0 0 0 ? I< Mar05 0:00 \_ [kworker/7:0H-events_highpri]
root 61 0.0 0.0 0 0 ? S Mar05 0:00 \_ [kdevtmpfs]
root 62 0.0 0.0 0 0 ? I< Mar05 0:00 \_ [inet_frag_wq]
root 63 0.0 0.0 0 0 ? S Mar05 0:00 \_ [kauditd]
root 66 0.0 0.0 0 0 ? S Mar05 1:14 \_ [khungtaskd]
root 67 0.0 0.0 0 0 ? S Mar05 0:00 \_ [oom_reaper]
root 68 0.0 0.0 0 0 ? I< Mar05 0:00 \_ [writeback]
root 69 0.1 0.0 0 0 ? S Mar05 246:13 \_ [kcompactd0]
root 70 0.0 0.0 0 0 ? SN Mar05 0:00 \_ [ksmd]
root 71 0.0 0.0 0 0 ? SN Mar05 12:39 \_ [khugepaged]
root 118 0.0 0.0 0 0 ? I< Mar05 0:00 \_ [kintegrityd]
root 119 0.0 0.0 0 0 ? I< Mar05 0:00 \_ [kblockd]
root 120 0.0 0.0 0 0 ? I< Mar05 0:00 \_ [blkcg_punt_bio]
root 122 0.0 0.0 0 0 ? I< Mar05 0:00 \_ [tpm_dev_wq]
root 123 0.0 0.0 0 0 ? I< Mar05 0:00 \_ [ata_sff]
root 124 0.0 0.0 0 0 ? I< Mar05 0:00 \_ [md]
root 125 0.0 0.0 0 0 ? I< Mar05 0:00 \_ [edac-poller]
root 126 0.0 0.0 0 0 ? I< Mar05 0:00 \_ [devfreq_wq]
root 127 0.0 0.0 0 0 ? S Mar05 0:00 \_ [watchdogd]
root 129 0.0 0.0 0 0 ? I< Mar05 5:55 \_ [kworker/7:1H-kblockd]
root 131 0.2 0.0 0 0 ? S Mar05 429:02 \_ [kswapd0]
root 132 0.0 0.0 0 0 ? S Mar05 0:00 \_ [ecryptfs-kthrea]
root 134 0.0 0.0 0 0 ? I< Mar05 0:00 \_ [kthrotld]
root 135 0.0 0.0 0 0 ? I< Mar05 0:00 \_ [acpi_thermal_pm]
root 137 0.0 0.0 0 0 ? S Mar05 0:00 \_ [scsi_eh_0]
root 138 0.0 0.0 0 0 ? I< Mar05 0:00 \_ [scsi_tmf_0]
root 139 0.0 0.0 0 0 ? S Mar05 0:00 \_ [scsi_eh_1]
root 140 0.0 0.0 0 0 ? I< Mar05 0:00 \_ [scsi_tmf_1]
root 142 0.0 0.0 0 0 ? I< Mar05 0:00 \_ [vfio-irqfd-clea]
root 144 0.0 0.0 0 0 ? I< Mar05 0:00 \_ [mld]
root 145 0.0 0.0 0 0 ? R< Mar05 5:51 \_ [kworker/2:1H+kblockd]
root 146 0.0 0.0 0 0 ? I< Mar05 0:00 \_ [ipv6_addrconf]
root 159 0.0 0.0 0 0 ? I< Mar05 0:00 \_ [kstrp]
root 162 0.0 0.0 0 0 ? I< Mar05 0:00 \_ [zswap-shrink]
root 163 0.0 0.0 0 0 ? I< Mar05 0:00 \_ [kworker/u17:0]
root 168 0.0 0.0 0 0 ? I< Mar05 0:00 \_ [charger_manager]
root 215 0.0 0.0 0 0 ? S Mar05 0:00 \_ [scsi_eh_2]
root 217 0.0 0.0 0 0 ? I< Mar05 0:00 \_ [scsi_tmf_2]
root 223 0.0 0.0 0 0 ? I< Mar05 4:55 \_ [kworker/3:1H-kblockd]
root 224 0.0 0.0 0 0 ? I< Mar05 5:34 \_ [kworker/1:1H-kblockd]
root 245 0.0 0.0 0 0 ? S Mar05 29:40 \_ [jbd2/sda3-8]
root 246 0.0 0.0 0 0 ? I< Mar05 0:00 \_ [ext4-rsv-conver]
root 275 0.0 0.0 0 0 ? I< Mar05 4:41 \_ [kworker/6:1H-kblockd]
root 277 0.0 0.0 0 0 ? I< Mar05 6:23 \_ [kworker/5:1H-kblockd]
root 308 0.0 0.0 0 0 ? I< Mar05 4:43 \_ [kworker/4:1H-kblockd]
root 326 0.0 0.0 0 0 ? I< Mar05 5:55 \_ [kworker/0:1H-kblockd]
root 364 0.0 0.0 0 0 ? I< Mar05 0:00 \_ [cryptd]
root 395 0.0 0.0 0 0 ? S Mar05 0:00 \_ [jbd2/sda2-8]
root 396 0.0 0.0 0 0 ? I< Mar05 0:00 \_ [ext4-rsv-conver]
root 2698602 0.0 0.0 0 0 ? I Jul12 0:17 \_ [kworker/6:2-mm_percpu_wq]
root 2747634 0.0 0.0 0 0 ? I Jul12 0:06 \_ [kworker/4:0-mm_percpu_wq]
root 2849036 0.0 0.0 0 0 ? I Jul12 0:01 \_ [kworker/7:0-events]
root 2998275 0.0 0.0 0 0 ? I 02:24 0:01 \_ [kworker/5:1-mm_percpu_wq]
root 3028302 0.0 0.0 0 0 ? I 03:47 0:01 \_ [kworker/2:0-cgroup_destroy]
root 3033583 0.0 0.0 0 0 ? I 04:01 0:04 \_ [kworker/7:1-mm_percpu_wq]
root 3050837 0.0 0.0 0 0 ? I 04:48 0:03 \_ [kworker/3:2-events]
root 3092947 0.1 0.0 0 0 ? I 06:44 0:11 \_ [kworker/0:2-events]
root 3093859 0.0 0.0 0 0 ? I 06:46 0:02 \_ [kworker/2:2-events]
root 3102726 0.1 0.0 0 0 ? I 07:10 0:11 \_ [kworker/u16:3-ext4-rsv-conversion]
root 3112088 0.0 0.0 0 0 ? I 07:35 0:02 \_ [kworker/1:0-rcu_gp]
root 3120728 0.0 0.0 0 0 ? I 07:59 0:00 \_ [kworker/6:1]
root 3131601 0.0 0.0 0 0 ? I 08:26 0:00 \_ [kworker/5:0-events]
root 3144423 0.0 0.0 0 0 ? I 09:01 0:00 \_ [kworker/3:0-mm_percpu_wq]
root 3145746 0.0 0.0 0 0 ? I 09:04 0:00 \_ [kworker/4:2]
root 3150580 0.1 0.0 0 0 ? I 09:17 0:01 \_ [kworker/u16:0-writeback]
root 3150760 0.0 0.0 0 0 ? I 09:17 0:00 \_ [kworker/1:2-mm_percpu_wq]
root 3153525 0.0 0.0 0 0 ? I 09:24 0:00 \_ [kworker/0:0]
root 3155513 0.0 0.0 0 0 ? I 09:29 0:00 \_ [kworker/u16:1-events_power_efficient]
root 1 0.0 0.0 167316 7212 ? Ss Mar05 31:01 /sbin/init
root 282 0.0 0.1 80784 31204 ? S<s Mar05 49:18 /lib/systemd/systemd-journald
root 330 0.0 0.0 25224 1728 ? Ss Mar05 1:14 /lib/systemd/systemd-udevd
systemd+ 434 0.0 0.0 89356 236 ? Ssl Mar05 1:09 /lib/systemd/systemd-timesyncd
root 478 0.0 0.0 240256 1492 ? Ssl Mar05 19:27 /usr/libexec/accounts-daemon
root 479 0.0 0.0 9492 676 ? Ss Mar05 1:08 /usr/sbin/cron -f -P
message+ 480 0.0 0.0 8904 1524 ? Ss Mar05 2:27 @dbus-daemon --system --address=systemd: --nofork --nopidfile --systemd-a
root 486 0.0 0.0 82768 960 ? Ssl Mar05 10:09 /usr/sbin/irqbalance --foreground
root 487 0.0 0.0 35776 5368 ? Ss Mar05 0:10 /usr/bin/python3 /usr/bin/networkd-dispatcher --run-startup-triggers
root 492 0.0 0.0 15896 2508 ? Ss Mar05 1:40 /lib/systemd/systemd-logind
root 527 0.0 0.0 234484 1460 ? Ssl Mar05 0:05 /usr/libexec/polkitd --no-debug
systemd+ 574 0.0 0.0 16500 2744 ? Ss Mar05 4:20 /lib/systemd/systemd-networkd
systemd+ 576 0.0 0.0 25664 2876 ? Ss Mar05 8:36 /lib/systemd/systemd-resolved
root 580 0.0 0.0 112444 1280 ? Ssl Mar05 0:00 /usr/bin/python3 /usr/share/unattended-upgrades/unattended-upgrade-shutdo
root 581 0.2 0.0 1801740 21140 ? Ssl Mar05 556:09 /usr/bin/containerd
root 585 0.0 0.0 8772 88 tty1 Ss+ Mar05 0:00 /sbin/agetty -o -p -- \u --noclear tty1 linux
root 586 0.0 0.0 15424 2504 ? Ss Mar05 23:48 sshd: /usr/sbin/sshd -D [listener] 0 of 10-100 startups
root 3155109 0.0 0.0 17052 10628 ? Ss 09:28 0:00 \_ sshd: crius [priv]
crius 3155148 0.0 0.0 17188 7928 ? S 09:28 0:00 \_ sshd: crius@pts/2
crius 3155149 0.1 0.0 11412 5340 pts/2 Ss 09:28 0:00 \_ -bash
crius 3155643 0.0 0.0 13576 4128 pts/2 R+ 09:30 0:00 \_ ps auxf
root 623 0.4 0.1 2417520 54884 ? Ssl Mar05 840:05 /usr/bin/dockerd -H fd:// --containerd=/run/containerd/containerd.sock
root 2890936 0.0 0.0 1157000 844 ? Sl May14 0:22 \_ /usr/bin/docker-proxy -proto tcp -host-ip 0.0.0.0 -host-port 2053 -co
root 2344276 0.0 0.0 1083012 740 ? Sl Jun12 0:11 \_ /usr/bin/docker-proxy -proto tcp -host-ip 0.0.0.0 -host-port 9090 -co
root 2374753 0.0 0.0 1083268 908 ? Sl Jun12 0:12 \_ /usr/bin/docker-proxy -proto tcp -host-ip 0.0.0.0 -host-port 8443 -co
root 2748545 0.0 0.0 1304208 692 ? Sl Jul12 0:00 \_ /usr/bin/docker-proxy -proto tcp -host-ip 0.0.0.0 -host-port 443 -con
root 2748566 0.0 0.0 1230988 704 ? Sl Jul12 0:00 \_ /usr/bin/docker-proxy -proto tcp -host-ip 0.0.0.0 -host-port 80 -cont
root 1674 0.0 0.0 298144 2608 ? Ssl Mar05 2:11 /usr/libexec/packagekitd
crius 1442337 0.0 0.0 17396 4392 ? Ss Mar09 14:47 /lib/systemd/systemd --user
crius 1442338 0.0 0.0 169832 300 ? S Mar09 0:00 \_ (sd-pam)
crius 1442416 0.0 0.0 10048 600 ? Ss Mar09 0:00 SCREEN -S ngi_avatar_migration
crius 1442417 0.0 0.0 11284 952 pts/1 Ss+ Mar09 0:00 \_ /bin/bash
crius 2539604 0.0 0.0 730088 5076 ? Sl May13 12:18 /home/crius/.docker/cli-plugins/docker-compose compose up
crius 2543461 0.0 0.0 729832 4092 ? Sl May13 12:41 /home/crius/.docker/cli-plugins/docker-compose compose up
crius 2546257 0.0 0.0 730344 4704 ? Sl May14 12:03 /home/crius/.docker/cli-plugins/docker-compose compose up
root 2890626 0.0 0.0 720756 3528 ? Sl May14 18:49 /usr/bin/containerd-shim-runc-v2 -namespace moby -id 96d87302799096e81906
systemd+ 2890647 0.1 0.1 2391320 39520 ? Ssl May14 117:20 \_ mariadbd --max-allowed-packet=64MB
root 2890739 0.0 0.0 720756 3804 ? Sl May14 25:15 /usr/bin/containerd-shim-runc-v2 -namespace moby -id adf21bdea1e5b2ae1324
root 2890764 0.0 0.0 203348 3348 ? Ss May14 10:22 \_ php-fpm: master process (/usr/local/etc/php-fpm.conf)
82 2723195 0.4 0.1 228180 47224 ? S Jul12 4:24 \_ php-fpm: pool www
82 2915709 0.2 0.1 219164 39312 ? S Jul12 1:32 \_ php-fpm: pool www
82 2915722 0.2 0.1 224888 44924 ? S Jul12 1:27 \_ php-fpm: pool www
root 2890959 0.0 0.0 720756 2524 ? Sl May14 18:43 /usr/bin/containerd-shim-runc-v2 -namespace moby -id 553a3e7389eb5c8433ef
root 2890983 0.0 0.0 8008 384 ? Ss May14 0:00 \_ nginx: master process nginx -g daemon off;
systemd+ 2891099 0.0 0.0 9008 2736 ? S May14 8:04 \_ nginx: worker process
systemd+ 2891100 0.0 0.0 9128 2980 ? S May14 8:05 \_ nginx: worker process
systemd+ 2891101 0.0 0.0 9064 2816 ? S May14 7:59 \_ nginx: worker process
systemd+ 2891102 0.0 0.0 8952 2912 ? S May14 8:05 \_ nginx: worker process
systemd+ 2891103 0.0 0.0 9016 2672 ? S May14 8:00 \_ nginx: worker process
systemd+ 2891104 0.0 0.0 9176 2820 ? S May14 8:00 \_ nginx: worker process
systemd+ 2891105 0.0 0.0 9104 2728 ? S May14 8:00 \_ nginx: worker process
systemd+ 2891106 0.0 0.0 9064 2772 ? S May14 8:03 \_ nginx: worker process
root 2913104 0.0 0.0 721012 4236 ? Sl May14 19:44 /usr/bin/containerd-shim-runc-v2 -namespace moby -id 9b95fa3156bba900a592
root 2913124 0.0 0.0 3896 224 ? Ss May14 0:00 \_ bash -c bash -s <<EOF trap "break;exit" SIGHUP SIGINT SIGTERM while /
root 2913193 0.0 0.0 3896 720 ? S May14 0:04 \_ bash -s
root 3145448 0.0 0.0 2392 428 ? S 09:03 0:00 \_ sleep 3600
root 727413 0.0 0.0 720756 3328 ? Sl May18 18:14 /usr/bin/containerd-shim-runc-v2 -namespace moby -id 581664b0fe9ab6478cb9
root 727452 1.0 0.0 716432 15932 ? Ssl May18 866:43 \_ /go/bin/docker_state_exporter -listen-address=:8080
root 727445 0.0 0.0 720500 4024 ? Sl May18 18:31 /usr/bin/containerd-shim-runc-v2 -namespace moby -id 8fe73c0019b1e003d040
nobody 727472 0.0 0.0 727104 12732 ? Ssl May18 58:50 \_ /bin/node_exporter --path.rootfs=/host
root 727504 0.0 0.0 720756 5208 ? Sl May18 46:22 /usr/bin/containerd-shim-runc-v2 -namespace moby -id fbba6c927dd83c1a7960
root 727564 10.3 0.2 215116 72624 ? Ssl May18 8372:45 \_ /usr/bin/cadvisor -logtostderr
root 727546 0.0 0.0 720756 2844 ? Sl May18 19:57 /usr/bin/containerd-shim-runc-v2 -namespace moby -id 408e050e9dc9b779f439
root 727574 0.0 0.0 9072 532 ? Ss May18 0:00 \_ nginx: master process nginx -g daemon off;
systemd+ 727820 0.0 0.0 9604 2800 ? S May18 1:28 \_ nginx: worker process
systemd+ 727821 0.0 0.0 9604 2768 ? S May18 1:29 \_ nginx: worker process
systemd+ 727823 0.0 0.0 9604 2844 ? S May18 1:24 \_ nginx: worker process
systemd+ 727824 0.0 0.0 9604 2800 ? S May18 1:21 \_ nginx: worker process
systemd+ 727825 0.0 0.0 9604 2784 ? S May18 1:20 \_ nginx: worker process
systemd+ 727826 0.0 0.0 9604 2576 ? S May18 1:16 \_ nginx: worker process
systemd+ 727827 0.0 0.0 9604 2828 ? S May18 1:16 \_ nginx: worker process
systemd+ 727828 0.0 0.0 9604 2820 ? S May18 1:17 \_ nginx: worker process
root 3271398 0.0 0.0 720756 3844 ? Sl May22 16:10 /usr/bin/containerd-shim-runc-v2 -namespace moby -id e2af5bfa922f8b3513bb
root 3271418 0.0 0.0 727512 14900 ? Ssl May22 40:12 \_ /bin/blackbox_exporter --config.file=/config/blackbox.yaml
syslog 3680620 0.0 0.0 222404 2844 ? Ssl May23 6:29 /usr/sbin/rsyslogd -n -iNONE
root 3683957 0.0 0.0 41328 2772 ? Ss May23 0:43 /usr/lib/postfix/sbin/master -w
postfix 2748725 0.0 0.0 41592 5228 ? S Jul12 0:00 \_ qmgr -l -t unix -u
postfix 3146384 0.0 0.0 41548 6652 ? S 09:05 0:00 \_ pickup -l -t unix -u -c
root 2344320 0.0 0.0 720500 4204 ? Sl Jun12 11:48 /usr/bin/containerd-shim-runc-v2 -namespace moby -id 400e496902d765603a25
nobody 2344347 1.1 0.5 2905480 155696 ? Rsl Jun12 502:21 \_ /bin/prometheus --config.file=/app.cfg/prometheus.yaml --storage.tsdb
root 2374785 0.0 0.0 720500 2976 ? Sl Jun12 12:15 /usr/bin/containerd-shim-runc-v2 -namespace moby -id 5164921ee23304d40f4b
472 2374814 0.6 0.3 883336 93316 ? Ssl Jun12 305:17 \_ grafana server --homepath=/usr/share/grafana --config=/etc/grafana/gr
root 2748589 0.0 0.0 720500 3308 ? Sl Jul12 0:24 /usr/bin/containerd-shim-runc-v2 -namespace moby -id 2c81f3b51e743cb2a695
root 2748621 0.0 0.0 6964 332 ? Ss+ Jul12 0:00 \_ /bin/bash /sbin/boot
root 2748731 0.0 0.0 2400 8 ? S+ Jul12 0:02 \_ /usr/bin/runsvdir -P /etc/service
root 2748732 0.0 0.0 2248 208 ? Ss Jul12 0:00 | \_ runsv cron
root 2748738 0.0 0.0 6680 916 ? S Jul12 0:01 | | \_ cron -f
root 2748733 0.0 0.0 2248 16 ? Ss Jul12 0:00 | \_ runsv rsyslog
root 2748741 0.0 0.0 151124 200 ? Sl Jul12 0:00 | | \_ rsyslogd -n
root 2748734 0.0 0.0 2248 108 ? Ss Jul12 0:00 | \_ runsv postgres
root 2748740 0.0 0.0 2396 152 ? S Jul12 0:06 | | \_ svlogd /var/log/postgres
systemd+ 2748751 0.3 0.3 4387564 97536 ? S Jul12 3:50 | | \_ /usr/lib/postgresql/13/bin/postmaster -D /etc/postgresql/
systemd+ 2748817 0.3 13.8 4389228 4261892 ? Ss Jul12 3:27 | | \_ postgres: 13/main: checkpointer
systemd+ 2748818 0.3 13.8 4387696 4254112 ? Ss Jul12 3:11 | | \_ postgres: 13/main: background writer
systemd+ 2748819 0.3 0.0 4387564 18768 ? Ss Jul12 3:59 | | \_ postgres: 13/main: walwriter
systemd+ 2748820 0.0 0.0 4388108 4804 ? Ss Jul12 0:02 | | \_ postgres: 13/main: autovacuum launcher
systemd+ 2748821 0.5 0.0 67860 2520 ? Ss Jul12 6:01 | | \_ postgres: 13/main: stats collector
systemd+ 2748822 0.0 0.0 4388120 3328 ? Ss Jul12 0:00 | | \_ postgres: 13/main: logical replication launcher
systemd+ 2843545 0.0 0.3 4399008 109852 ? Ss Jul12 0:02 | | \_ postgres: 13/main: discourse discourse [local] idle
systemd+ 2843992 0.0 3.0 4405064 928824 ? Ss Jul12 0:03 | | \_ postgres: 13/main: discourse discourse [local] idle
systemd+ 2852883 0.0 0.8 4396836 272064 ? Ss Jul12 0:04 | | \_ postgres: 13/main: discourse discourse [local] idle
systemd+ 2852884 0.0 7.5 4405456 2335560 ? Ss Jul12 0:08 | | \_ postgres: 13/main: discourse discourse [local] idle
systemd+ 2852887 0.0 7.1 4405764 2189764 ? Ss Jul12 0:11 | | \_ postgres: 13/main: discourse discourse [local] idle
systemd+ 2899553 0.0 2.2 4397092 691820 ? Ss Jul12 0:13 | | \_ postgres: 13/main: discourse discourse [local] idle
systemd+ 3037776 3.3 14.1 4526944 4346572 ? Ss 04:12 10:34 | | \_ postgres: 13/main: discourse discourse [local] idle
systemd+ 3064125 0.0 0.9 4395760 306864 ? Ss 05:25 0:01 | | \_ postgres: 13/main: discourse discourse [local] idle
systemd+ 3114121 2.0 13.0 4519752 4027320 ? Ss 07:41 2:11 | | \_ postgres: 13/main: discourse discourse [local] idle
systemd+ 3116277 2.7 13.0 4519504 4030420 ? Ss 07:47 2:48 | | \_ postgres: 13/main: discourse discourse [local] idle
systemd+ 3116411 3.9 13.5 4517844 4173364 ? Ss 07:47 4:04 | | \_ postgres: 13/main: discourse discourse [local] idle
systemd+ 3117196 1.4 12.9 4515768 3982940 ? Ss 07:49 1:28 | | \_ postgres: 13/main: discourse discourse [local] idle
systemd+ 3117708 2.1 13.1 4517008 4057736 ? Ss 07:50 2:09 | | \_ postgres: 13/main: discourse discourse [local] idle
systemd+ 3118017 4.8 13.8 4526084 4260840 ? Ss 07:51 4:45 | | \_ postgres: 13/main: discourse discourse [local] idle
systemd+ 3118048 3.2 13.3 4525892 4111704 ? Ss 07:51 3:14 | | \_ postgres: 13/main: discourse discourse [local] idle
systemd+ 3128686 0.7 6.1 4405988 1909256 ? Ss 08:19 0:30 | | \_ postgres: 13/main: discourse discourse [local] idle
systemd+ 3128687 0.7 6.6 4398936 2052828 ? Ss 08:19 0:30 | | \_ postgres: 13/main: discourse discourse [local] idle
systemd+ 3130657 0.9 6.8 4405580 2113692 ? Ss 08:24 0:37 | | \_ postgres: 13/main: discourse discourse [local] idle
systemd+ 3134864 1.2 6.1 4405228 1908596 ? Ss 08:35 0:40 | | \_ postgres: 13/main: discourse discourse [local] idle
systemd+ 3134893 0.8 4.5 4405496 1389992 ? Ss 08:35 0:29 | | \_ postgres: 13/main: discourse discourse [local] idle
systemd+ 3144272 1.4 4.5 4405884 1412496 ? Ss 09:00 0:25 | | \_ postgres: 13/main: discourse discourse [local] idle
systemd+ 3144691 1.0 8.2 4406004 2554024 ? Ss 09:01 0:17 | | \_ postgres: 13/main: discourse discourse [local] idle
systemd+ 3147010 1.3 5.2 4405288 1619456 ? Ss 09:07 0:19 | | \_ postgres: 13/main: discourse discourse [local] idle
systemd+ 3154498 0.4 0.9 4398792 304316 ? Ss 09:27 0:00 | | \_ postgres: 13/main: discourse discourse [local] idle
systemd+ 3155429 0.3 0.2 4390740 72012 ? Ss 09:29 0:00 | | \_ postgres: 13/main: discourse discourse [local] idle
systemd+ 3155430 0.5 0.6 4390000 199852 ? Ss 09:29 0:00 | | \_ postgres: 13/main: discourse discourse [local] idle
systemd+ 3155431 0.1 0.3 4389928 104328 ? Ss 09:29 0:00 | | \_ postgres: 13/main: discourse discourse [local] idle
systemd+ 3155435 0.2 0.2 4389760 62116 ? Ss 09:29 0:00 | | \_ postgres: 13/main: discourse discourse [local] idle
root 2748735 0.0 0.0 2248 4 ? Ss Jul12 0:00 | \_ runsv unicorn
crius 2748742 0.1 0.0 15316 2496 ? S Jul12 2:01 | | \_ /bin/bash config/unicorn_launcher -E production -c config
crius 3155642 0.0 0.0 13820 2164 ? S 09:30 0:00 | | \_ sleep 1
root 2748736 0.0 0.0 2248 124 ? Ss Jul12 0:00 | \_ runsv nginx
root 2748739 0.0 0.0 53344 604 ? S Jul12 0:00 | | \_ nginx: master process /usr/sbin/nginx
www-data 2748754 0.6 0.0 58380 8120 ? S Jul12 6:57 | | \_ nginx: worker process
www-data 2748755 0.6 0.0 58376 8664 ? S Jul12 6:55 | | \_ nginx: worker process
www-data 2748756 0.6 0.0 58356 8136 ? S Jul12 6:51 | | \_ nginx: worker process
www-data 2748757 0.6 0.0 59308 8080 ? S Jul12 6:41 | | \_ nginx: worker process
www-data 2748758 0.6 0.0 58528 7820 ? S Jul12 6:37 | | \_ nginx: worker process
www-data 2748759 0.6 0.0 58272 8208 ? S Jul12 6:51 | | \_ nginx: worker process
www-data 2748760 0.6 0.0 59100 8600 ? S Jul12 6:47 | | \_ nginx: worker process
www-data 2748761 0.6 0.0 58532 8188 ? S Jul12 6:50 | | \_ nginx: worker process
www-data 2748762 0.0 0.0 53540 588 ? S Jul12 0:01 | | \_ nginx: cache manager process
root 2748737 0.0 0.0 2248 44 ? Ss Jul12 0:00 | \_ runsv redis
root 2748743 0.0 0.0 2396 16 ? S Jul12 0:00 | \_ svlogd /var/log/redis
message+ 2748750 4.1 0.2 293132 68876 ? Sl Jul12 42:44 | \_ /usr/bin/redis-server *:6379
crius 2843290 0.1 1.0 696992 310896 ? Sl Jul12 1:27 \_ unicorn master -E production -c config/unicorn.conf.rb
crius 2843716 3.6 1.1 1481356 368076 ? SNl Jul12 29:41 | \_ sidekiq 6.5.9 discourse [0 of 5 busy]
crius 2843729 1.7 0.7 1019336 232084 ? Sl Jul12 14:44 | \_ discourse prometheus-global-reporter
crius 2843769 27.3 1.3 1227948 417356 ? Rl Jul12 224:30 | \_ unicorn worker[0] -E production -c config/unicorn.conf.rb
crius 2843826 15.9 1.2 1140968 397560 ? Rl Jul12 131:12 | \_ unicorn worker[2] -E production -c config/unicorn.conf.rb
crius 2843891 9.5 1.1 1114024 353860 ? Rl Jul12 78:12 | \_ unicorn worker[4] -E production -c config/unicorn.conf.rb
crius 2843918 7.1 1.2 1142248 383800 ? Rl Jul12 58:40 | \_ unicorn worker[5] -E production -c config/unicorn.conf.rb
crius 2843965 5.7 1.0 1074792 336012 ? Rl Jul12 47:22 | \_ unicorn worker[6] -E production -c config/unicorn.conf.rb
crius 2844114 1.3 0.1 297232 39440 ? Sl Jul12 11:25 | \_ discourse prometheus-collector
crius 2844577 4.8 1.1 1121000 365044 ? Rl Jul12 40:05 | \_ unicorn worker[7] -E production -c config/unicorn.conf.rb
crius 2844866 4.4 1.0 1129704 328864 ? Rl Jul12 36:14 | \_ unicorn worker[1] -E production -c config/unicorn.conf.rb
crius 2902401 3.2 1.1 1214056 340712 ? Rl Jul12 22:10 | \_ unicorn worker[3] -E production -c config/unicorn.conf.rb
root 3155591 0.1 0.0 2388 76 ? Ss 09:30 0:00 \_ /usr/sbin/anacron -s
您的负载平均值 \u003e 8(在 8 vCPU 机器上)意味着您的服务器不堪重负。
在 8 个 unicorn 进程、许多 PostgreSQL 进程以及服务器上的其他所有东西之间,它无法足够快地处理传入的请求。至少您还有充足的内存 ![]()
Discourse 像这样在 unicorn CPU 上出现瓶颈是有点不寻常的。我见过这种情况发生的大多数时候都是因为某个行为不当的插件。您能分享您的 app.yml 文件吗?
另外,请分享加载您的主页和主题页面时的 MiniProfiler 结果。
看起来这个截图截掉了列标签,但如果前三个中的一个是平均值,你就解决了问题。

感谢您的输出。供参考,vmstat 的第一行统计信息不太有用——所有五行都提供了所需的图景。
抱歉,我忘记在这里更新了。
最终和我猜测的一样。主机上部署了另一个 VPS,并且正在耗尽其资源。
在提交工单不到 24 小时后,我们就被迁移到了另一台主机。
为 Contabo 点赞 ![]()
我想请求版主保留这些最后的回复,即使它们与“论坛”无关,因为它们可以帮助其他人找出导致其实例出现问题的其他原因。